
The term is derived from the Latin “divergere” which means to detect a discrepancy. In forex, a divergence usually means a warning given by a MACD indicator signaling a change in the existing trend to the opposite one.
Dear Valued Clients, the Company is currently reorganizing to better serve your investment needs. As part of this process, we are updating our services. During this transition, some website information may be temporarily unavailable.
The term is derived from the Latin “divergere” which means to detect a discrepancy. In forex, a divergence usually means a warning given by a MACD indicator signaling a change in the existing trend to the opposite one.
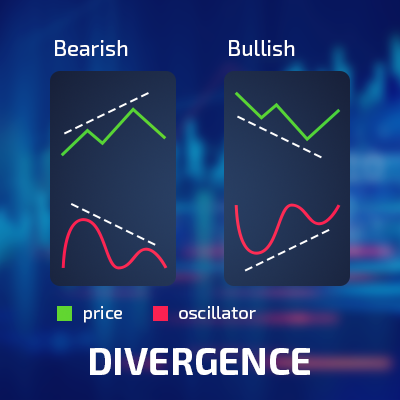
Divergence - a signal of a discrepancy between the quote price and the technical indicator.
As you know, trading with currencies, it is important to correctly predict not only the volatility of prices in general, but also, more importantly, the end of the trend and the beginning of a new one. At such peak moments, a lot is being decided. Watching the oscillators on the charts, the trader builds his own trading strategy, trying to earn money at peak times.
But it happens that, for example, the price rises, while the oscillators, on the contrary, decrease, showing that the actions of buyers or sellers have become less. That is, a price reversal is likely. Such moments are called “divergence”.
The most popular charts for observing divergence using oscillators are MACD, RSI, RVI, Stochastic and Momentum. In essence, divergence is a reaction to the volatile mood of those involved in trade. But there are times when inertia also causes divergence after strong changes in the market. In its most classic form, divergence is the moment when the price updates its upper highs, and oscillators, on the contrary, update the lower highs. Divergence itself is a phenomenon that does not occur so often, but it is of great benefit to bidders with due dexterity. After all, having noticed divergence, the trader will be at the very origins of a new trend, which may promise good profit in the future. For the convenience of using different types of divergence, special indicators of divergence have been developed that are actively used for earnings.
There are several types of divergence that can be distinguished, each of which has several variations, depending on the position of the price, with subclasses that already depend on the strength of the signals. Lets take a look at them.
Classical (Explicit) Divergence
The most significant and simplest form of divergence. Indicates the upcoming price reversal and the beginning of a new trend. It has two variations:
Hidden divergence
Latent divergence, in fact, is the opposite of explicit divergence in relation to price volatility and indicator. It speaks more about the continuation of the trend than about its reversal. Most often, latent divergence is inside the trend. It also has two main variations:
Extended divergence
The rarest form of divergence, when the indicators reach peaks (maximum or minimum) far from each other, at the same time as price peaks are at approximately at the same level, that is, the price rises / falls slightly. On the graph, this is expressed in the appearance of the so-called “double mountain effect” (at maximum) or “double bottom effect” (at minimum). Like other types of divergence, extended divergence also has its main variations:
Also, divergence signals are usually classified by strength. As a rule, they are divided into three classes: A, B and C.
Divergence is a very convenient tool, but it requires attention and certain experience from the trader. After all, its not always that changes in graphs are noticeable. It often happens that a discrepancy, which seems insignificant at first, in the future becomes important, and strongly affects both price volatility and the benefit that a trader will receive in the future. Divergence can be either single or many - when several discrepancies in the movement of prices and indicators appear on the chart at once. In this case, it is worth paying attention to the last divergence in the series.
Please note that our services are provided only to the residents of the following counties (in alphabetical order): Austria, Bulgaria, British Virgin Islands, Croatia, Cyprus, Czech Republic, Denmark, Estonia, Finland, France, Germany, Greece, Hungary, Ireland, Italy, Kazakhstan, Latvia, Lithuania, Luxembourg, Malta, Netherlands, Oman, People's Republic of China, Poland, Portugal, Romania, Russia, Slovakia,Slovenia, Spain, Sweden, Ukraine, United Arab Emirates.
Please feel free to contact out Support in order to get further assistance.